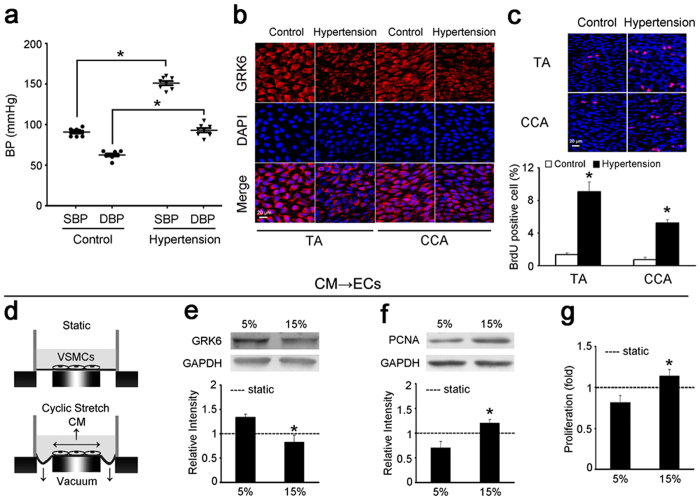
Figure 1. Hypertension decreased GRK6 expression but increased EC proliferation through a paracrine mechanism.
(a) BP of 1-week hypertensive rats and normotensive controls measured through catheters introduced into the carotid arteries (n = 8). (b) The expression of GRK6 in the ECs of the TA and CCA from hypertensive rats and controls detected by immunofluorescence. Scale bar = 20 μm. (c) The proliferation of ECs in the TA and CCA from hypertensive rats and controls detected by in situ BrdU immunofluorescence. The histogram shows the fold change in the level of EC proliferation relative to the control. Scale bar = 20 μm. Values are shown as mean ± SD for each condition from at least four independent experiments. *P < 0.05 vs. control. (d–g) VSMCs were exposed to static condition, 5% and 15% cyclic stretch for 24 h, respectively, and the CM was used to stimulate ECs for 24 h. (d) Schematic drawing of the cyclic stretch treatment and the CM obtained. (e) GRK6 expression and (f) PCNA expression of ECs were detected by western blotting. (g) Proliferation of ECs was detected by BrdU ELISA. ‘----’ indicates the static values standardized to 1. The values are expressed as the mean ± SD for each condition from at least four independent experiments. *P < 0.05 vs. 5%. Full-length blots are presented in Supplementary Fig. S7.

