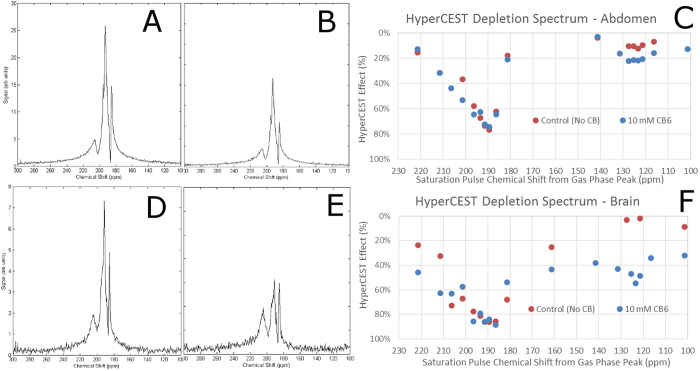
Figure 2. MR spectra and images for the abdomen of a Sprague-Dawley rat following IV injection of 3 mL of 10 mM CB6 solution.
(A) Free induction decay (FID) spectrum acquired in the abdominal region following the application of an off-resonance (control) pre-pulse at +260 ppm. (B) FID spectrum acquired following the application of an on-resonance HyperCEST pulse at +123.4 ppm. Notice the reduction in the SNR of the primary peak indicating a HyperCEST depletion. (C) HyperCEST depletion spectrum of the abdomen showing the HyperCEST effect as a function of the chemical shift offset of the saturation pulse. Notice a HyperCEST effect at the CB6 resonance frequency (+123.4 ppm) compared to its absence in the control experiment. (D–F) Identical to (A–C) but acquired at the head.

