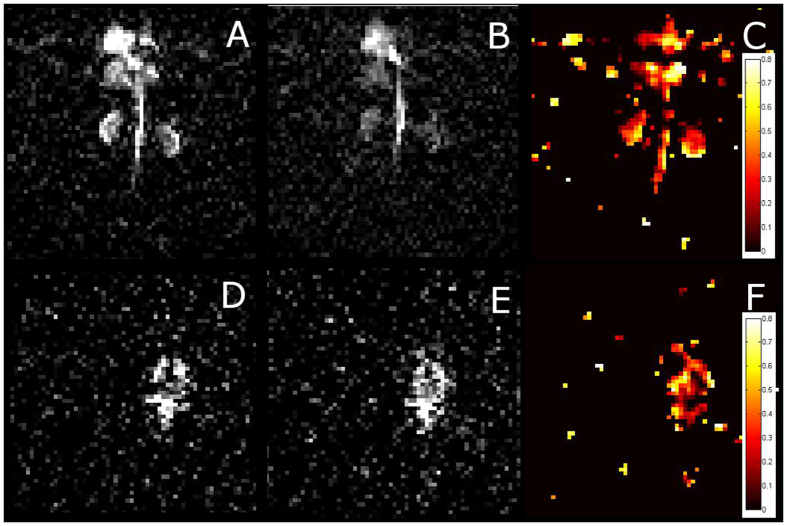
Figure 3. Xe MR images of a Sprague-Dawley rat following IV injection of 3 mL of 10 mM CB6 solution.
(A) A 2D gradient echo (GE) Xe MR image of the abdomen following the application of an off-resonance pre-pulse (+260 ppm). (B) Same as (A) but following an on-resonance HyperCEST saturation pre-pulse (+123.4), which destroys the polarization of the Xe in the CB6 cage. As these depolarized Xe atoms leave the cage, they reduce the pool of polarized Xe in the blood, thereby reducing the MR signal. (C) A saturation map constructed by subtracting, pixel-by-pixel, the on-resonance HyperCEST image from the off-resonance control image, and dividing by the off-resonance control image. This measures signal depletion and indicates the location of the CB6 cage molecule. (D–F) Same as images (A–C) but images acquired of the rat brain.

