
Figure 4.
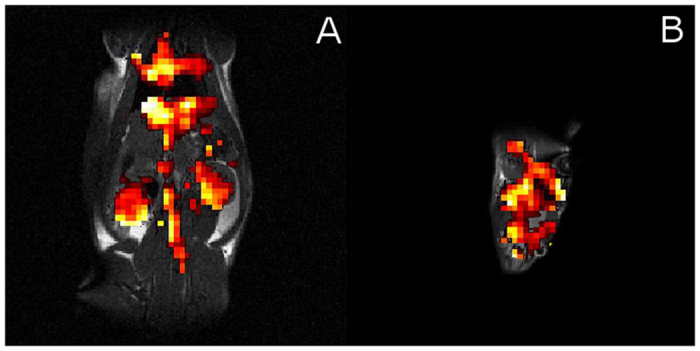
(A) HyperCEST saturation map of a rat abdomen zoomed in and overlaid on a 1H MR image showing the location of the CB6 cage contrast agent. Accumulation is noted in the heart (top of image), lungs, liver, aorta (midline), and the kidneys (lateral to aorta, upper abdominal quadrants). (B) Same as (A) but of the rat brain.