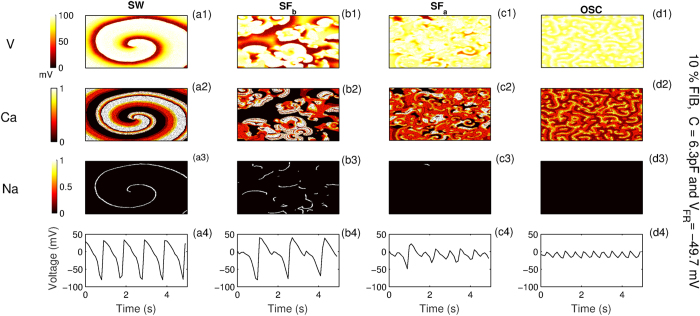
Figure 4.
Characterizing the different possible dynamical states and their corresponding time series, due to M-F coupling for stimulation P2. The columns correspond to spiral wave (SW), spiral fibrillation (SFb and SFa) and oscillatory dynamics respectively. The rows correspond to voltage, state of L-type Ca gates (=dff2fCass) and Na gates (=m3hj) respectively. Fully open gates have a value of 1, while fully closed gates have value 0. Parameters used are yGKr = 0.2, Gs = 0.5, with fibroblasts occupying 10% of the randomly chosen lattice points. The values of x (multiples of GCaL) are 2.25, 3.0, 3.5 and 4.75 for SW, SFa, SFb and OSC states respectively.

