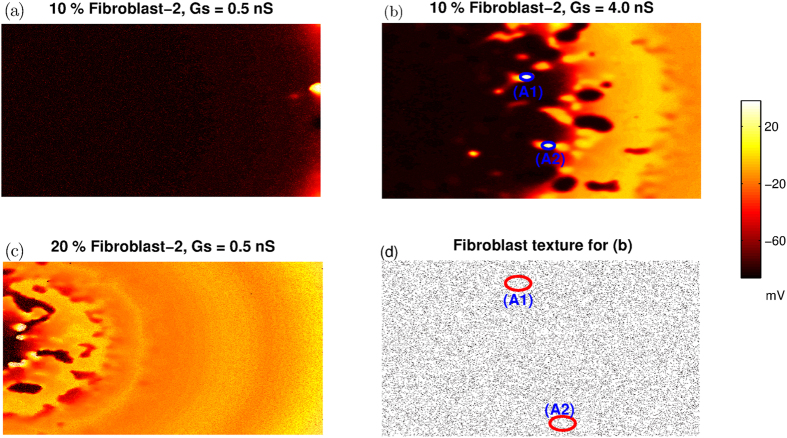
Figure 8.
Pseudocolor images of transmembrane potential highlighting the location of initiation of reentrant activity for fibroblast fractions 10% (a,b) and 20% (c,d). For panels (a,b,d) Fibroblast-2 (C = 50 pF and VFR = −49.7 mV) is used, while for panel (c) Fibroblast-1 (C = 6.3 pF and VFR = −24.5 mV) is used.

