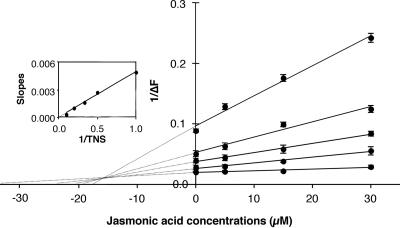
Figure 2.
Dixon's plot of the binding competition between JA and TNS to LTP1. Various amount of JA (0–30 μM) and TNS (1–10 μM) were incubated together for 1 min and then LTP1 (250 nM) was added. From top to bottom, linear regressions lead to the following cr2 values: 0.989, 0.972, 0.993, 0.981, and 0.915 for TNS concentrations of 1, 2, 3, 5, or 10 μM, respectively. Inset: replot of the slopes of the Dixon plots and linear regression (cr2 = 0.993). Experiments were performed in triplicate and results are expressed as the mean values ± SD.

