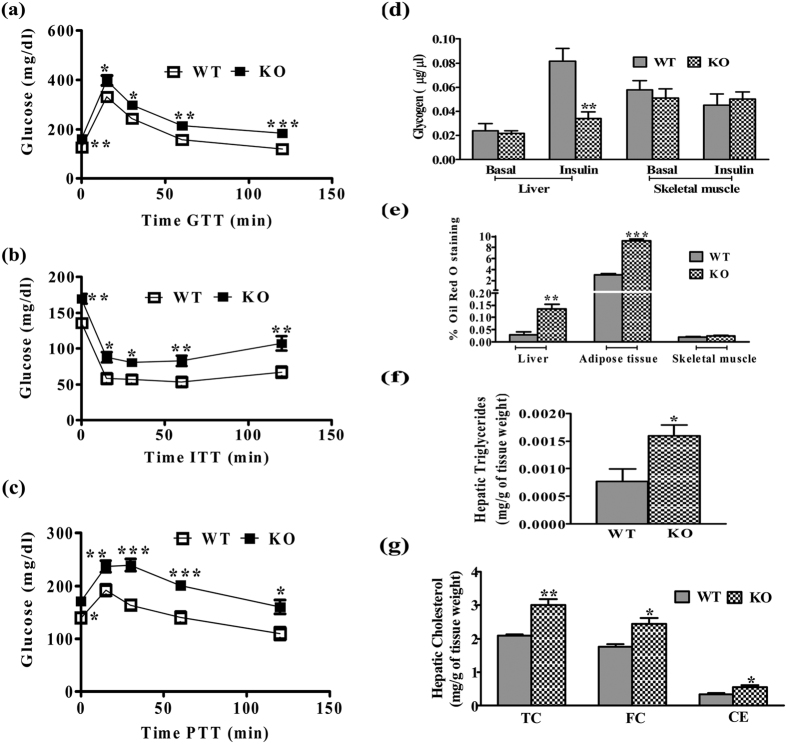
Figure 3. Systemic glycemic control and tissue biochemistry.
(a) GTT (n = 8), (b) ITT (n = 10), (c) PTT (n = 9), (d) hepatic and skeletal muscle glycogen content (n = 5), (e) hepatic, adipose tissue and skeletal muscle Oil red O staining (n = 5), (f,g) hepatic triglycerides and cholesterol (n = 5). Comparison between groups was done by Student’s t test. *p < 0.05, **p < 0.01 and ***p < 0.001 vs WT.

