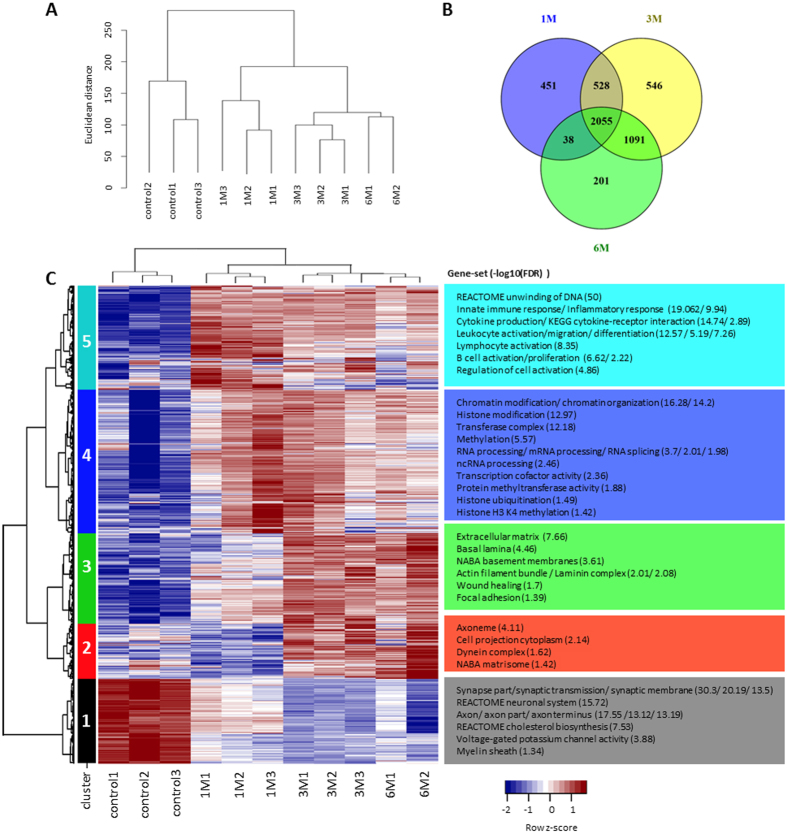
Figure 1. Gene expression profiles at 1 M, 3 M, and 6 M post-SCI compared to sham controls.
(A) Consensus dendrogram of 30,443 annotated genes, organized by Euclidean distance between log2-transformed quantile-normalized FPKM values. (B) Venn diagram depicting the extent of overlap between time points. (C) Hierarchical cluster analysis displaying temporal gene expression patterns of DEGs for each sample. Highly enriched gene-sets and ontologies were identified (hypergeometric test FDR < 0.05). The −log10(FDR) is indicated in parenthesis. The row z-scores depict the expression values normalized by gene.

