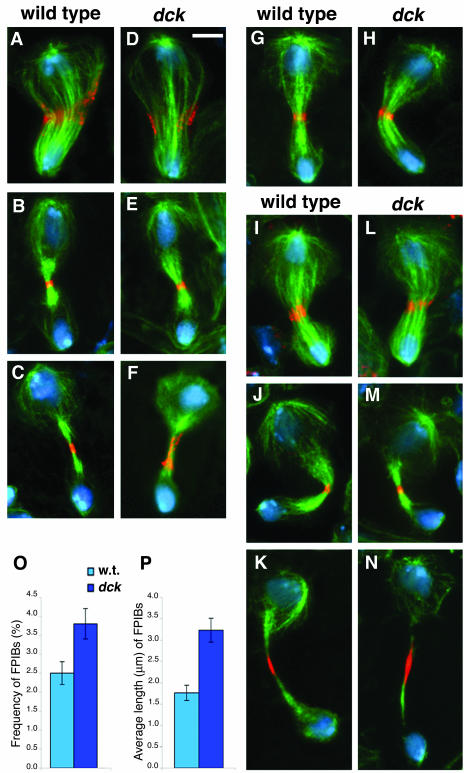
Figure 3.
Phenotypic analysis of dck mutant neuroblasts. (A–F) Wild-type (A–C) and dck mutant (D–F) telophases stained for tubulin (green), anillin (orange), and DNA (blue). A and D, early telophases; B and E, late telophases; C and F, very late telophases. Note the extended anillin signal associated with the midbody of the dck telophase figure shown in F. (G and H) Wild-type (G) and dck (H) mid/late telophases stained for tubulin (green), myosin II (orange), and DNA (blue). (I–N) Wild-type (I–K) and dck mutant (L-N) telophases stained for tubulin (green), Feo (orange), and DNA (blue). I and L, mid-telophases; J and M, late telophases; K and N, very late telophases. Note the extended Feo signals associated with late midbodies (K and N). Bar, 5 μm. (O) Frequency of Feopositive intercellular bridges (FPIBs, no. of bridges/no. interphase nuclei) ± SE in wild-type (w. t.) and dck mutant brains; p < 0.05. (P) Average length of FPIBs ± SEM in wild-type (w. t.) and dck mutant brains; p < 0.01. Note that the Feo-positive intercellular bridges are both longer and more frequent in dck mutant brains than in wild-type brains.

