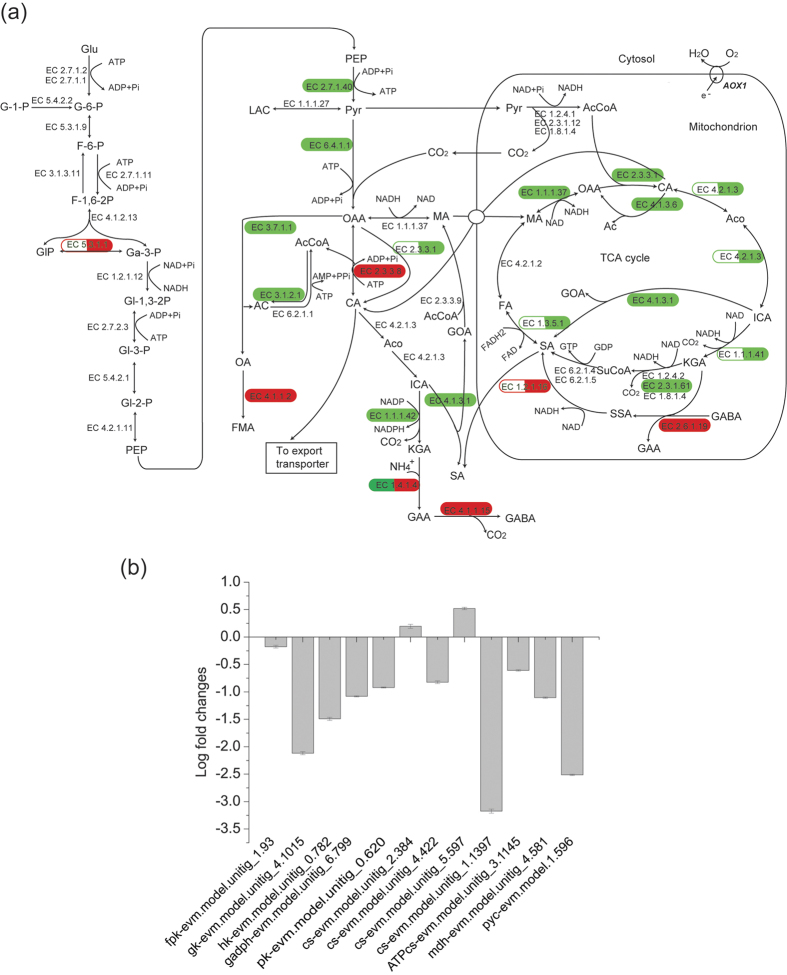
Figure 5. Transcription level regulation of genes in central metabolism.
(a) Transcription level regulation of genes in glycolysis and TCA cycle of H915-1 during citrate production. Red ellipse means up-regulated genes. Green ellipse means down-regulated genes. Half blank ellipse means that expression levels of some isoenzymes were not changed, while the other isoenzymes were affected. Abbreviations: GABA, 4-aminobutanoate; AC, acetate; AcA, acetaldehyde; AcCoA, acetyl-CoA; Aco, cis-aconitate; AOX1, alternative oxidase; CA, citrate; F-1,6–2P, fructose 1,6-bisphosphate; ETH, ethonal; F-6-P, fructose 6-phosphate; FA, fumarate; FMA, formate; G-6-P, Glucose 6-phosphate; Ga-3-P, glyceraldehyde 3-phosphate; GAA, glutamate; Glu, glucose; GI-1,3–2P, 3-phospho-D-glyceroyl phosphate; GI-2-P, 2-phospho-D-glycerate; GI-3-P, 3-phospho-D-glycerate; GIP, dihydroxyacetone phosphate; GOA, glyoxylate; ICA, isocitrate; KGA, 2-oxoglutarate; MA, malate; OA, oxalate; OAA, oxaloacetate; PEP, phosphoenolpyruvate; Pyr, pyruvate; SA, succinate; SSA, succinate semialdehyde; SuCoA, succinyl-CoA. (b) qPCR of gene expression fold changes of A1 at 60 h compared to H915-1 at 48 h. Error bars represent three technical replicates.

