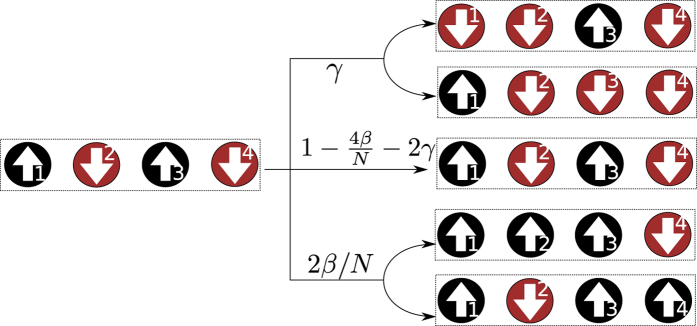
Figure 2. Markov process for N = 4 in a complete graph.
At time t, the probability to find the system in the configuration  is P5(t). Configuration |C5〉 may evolve into five distinct configurations, after the time interval δt, due to disease transmission and recovery processes in the SIS model. If the infected agent at k = 1 recovers, then the resulting configuration is |C4〉. Similarly, if the infected agent at k = 3 recovers, then the resulting configuration is |C1〉. Both events occur with transition rate γ. Concerning disease transmission events, the infected agent at k = 1 (k = 3) may either transmit the pathogen to the susceptible agent at k = 2 or k = 4, resulting in the configuration |C7〉 or |C13〉. Since both infected agents produce the same resulting configurations, in the complete graph, the transition rate is 2β/N. The remaining transition contemplates the event in which agents neither recover or transmission the pathogen. In this case, the resulting configuration is |C5〉, with transition rate 1 − 2γ − 4β/N.

