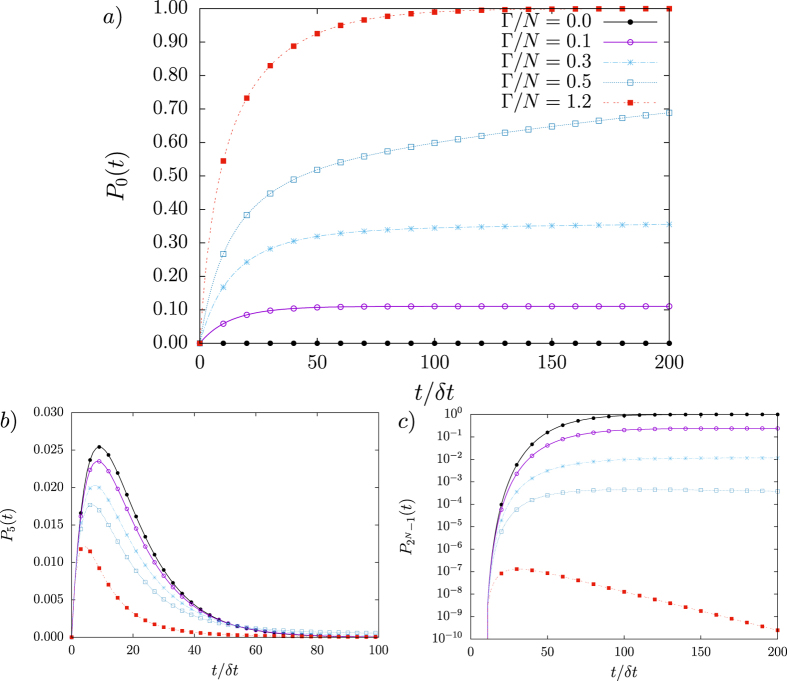
Figure 3. Configuration probabilities Pμ(t) for μ = 0, 5 and 2N − 1 with N = 12 in a complete network with initial condition P1(0) = 1 .
.
In (a) probability P0(t) to observe all-cured configuration at time t for various couplings  . In (b) P5(t) refers to the probability of transient configuration
  , while (c) exhibits the probability with all-infected agents,
  , in log scale. The coupling
  represents the SI model, whose stationary state is described by all-infected configuration. For
  , the stationary state is a linear combination of distinct |Cμ〉, including all-cured |C0〉 and all-infected
  configurations. For intermediate couplings
  and
and  , the stationary state is |C0〉 with large transient Δτ ~ o(N4).

