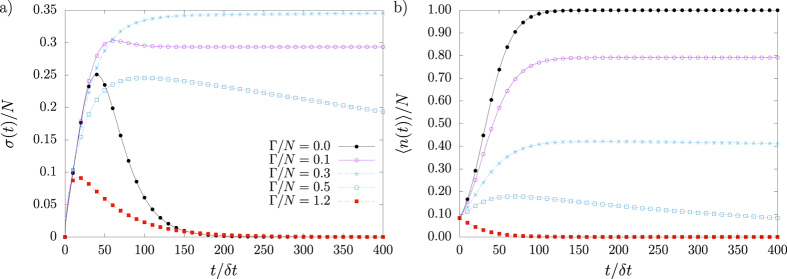
Figure 4. Standard deviation σ(t) and mean number of infected agents 〈n(t)〉 for SIS model with N = 12 in the complete network.
The statistics σ(t) and 〈n(t)〉 are shown in (a,b), respectively. Intermediate cure/infection rates  and
and  eradicate the disease after very large time intervals: σ(t) exhibits initial rapid growth, develops a maximum at
  and then decays as power-law.

