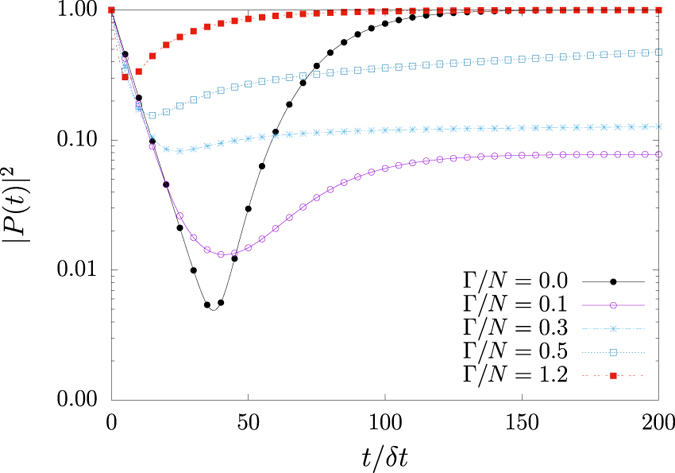
Figure 5. |P(t)|2: Sum of squared probabilities of infected agents in all possible configurations μ.

SIS model with N = 12 and P1(0) = 1. For each coupling parameter  , |P(t)|2 always develops a global minimum followed by constant value at stationary state, being unity only for single state configurations. Logarithmic scale is employed to emphasize extremal points at
  .
.
