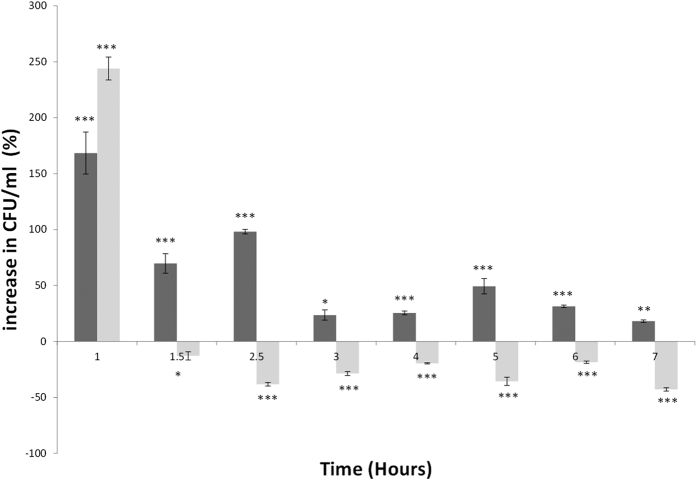
Figure 1. Clustered column graph representing percentage increase in cell proliferation of single (ϕ24B::ΔKan, dark grey) and double (ϕ24B::ΔKan, ϕ24B::ΔCat, light grey) MC1061 lysogens.
Cultures were grown at 37 °C (CFU.ml) and samples taken over a 7 hour period including experimental and technical replicates (n = 9). Percentage increases or decreases show differences in growth of the lysogens compared to the uninfected MC1061 represented here as 0 on the x axis. Significance threshold P values ***<0.001, **<0.01, *<0.05, significance below the x axis demonstrates greater growth from the Naïve host.

