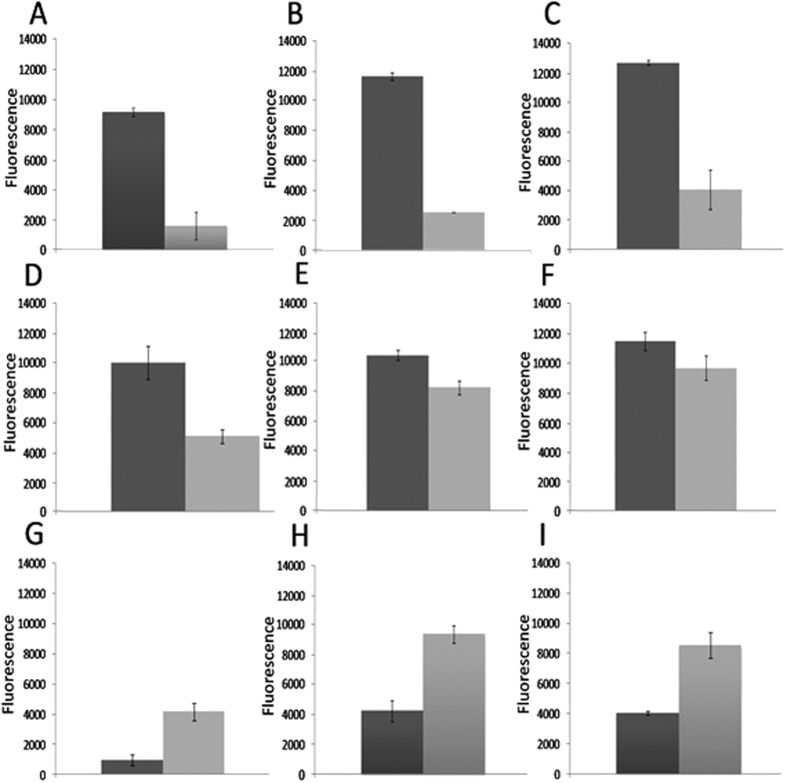
Figure 2. A comparison of Area Under the Respiration Curve (AURC) data from the Biolog bacterial phenotypic microarray.
Data plotted shows the addition of supplemented nutrients or chemical challenge showed statistically significant difference in rates of respiration between the lysogen and naïve MC1061 host (for P values see SI Table 2). Arbitrary Omnilog fluorescence values (y-axis) show differences between the naïve MC1061 (light grey) host and the lysogen (dark grey) over a 47.5 h time period (n = 3). Error bars represent SEM. Graphs A-F show significantly higher amount of respiration of the lysogen compared to the naïve host under the following conditions; (A) U-2-monophosphate, (B) 8-hydroxyquinoline, (C) chloroxylenol, (D) cefoxitin, (E) cefomendole and (F) amoxacillin. Graphs (G–I) show mean AURC values where growth on different carbon sources or chemical challenge that has a detrimental effect on the respiration of MC1061 when converted by ϕ24B, these inculde; (G) β_D-Allose, (H) ofloxacin and (I) oxolinic acid.

