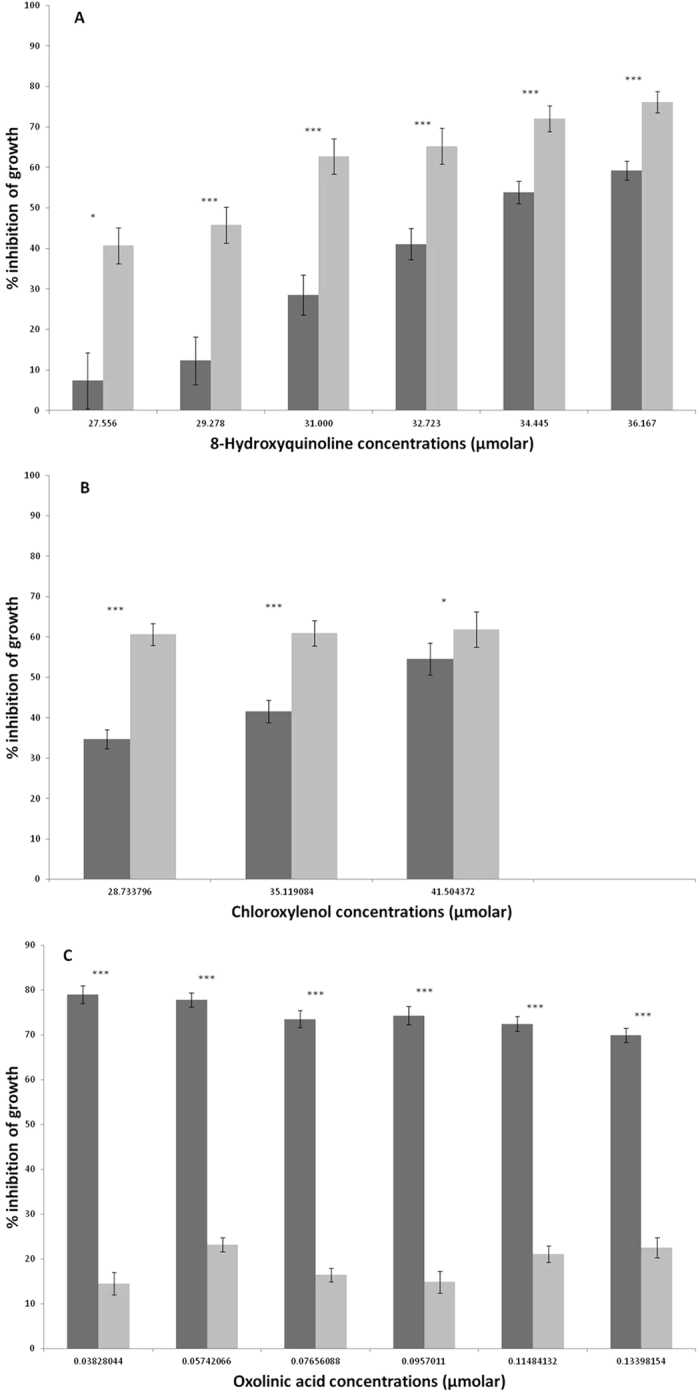
Figure 3.

Response in growth of both MC1061 (light grey) and the ϕ24B lysogen (Dark grey) to an increasing concentration of (A) 8-hydroxyquinoline, (B) chloroxylenol, and (C) oxolinic acid. Bacterial growth was measured by increase in optical density at 600 nm after 18 hours growth at 37 °C, as per original Biolog assay. Error bars represent the standard error of the mean (SEM) (n = 12). Significance represented by (P) thresholds; ***<0.001, **<0.01, *<0.05.
