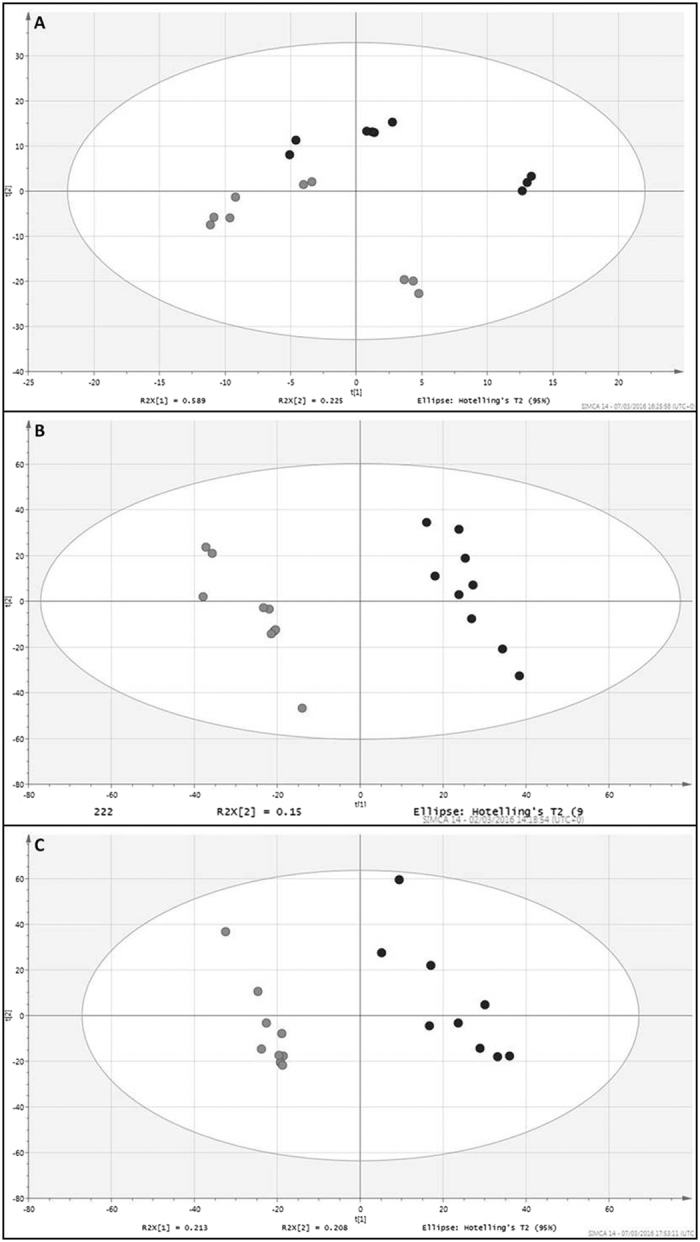
Figure 4.

(A–C) The metabolite profiles of MC1061 versus lysogen and multivariate analysis using partial least discriminant analysis (PLS-DA). The panels represent score plots from PLS-DA models of: (A) Standard growth conditions, and supplementation with (B) 8-hydroxyquinoline and (C) chloroxylenol, between the naïve host (light grey spot) and lysogen (dark grey spot), the model discriminatory parameters for the PLS-DA analysis are described in the results section and in SI Table 5.
