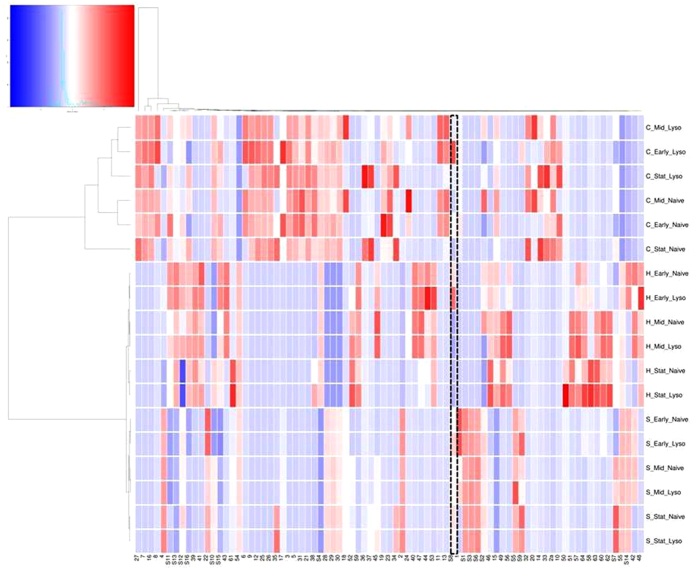
Figure 6. Heatmap generated by metabolic levels of 81 metabolites using HCA and DM Culture conditions and presence or absence of phage can be found alongside each profile (H = 8-hydroxyquinoline, C = chloroxylenol).
Each individual tile represents a metabolite. The colour of a given tile denotes higher or lower intensity of the metabolite. The colour scale key is: dark blue: lowest levels; white: mid-point; dark red: highest level. The gradient between these colours represents variation in the levels of the metabolite across the colour scale (putative ID’s can be found in SI Table 3). Pimelic acid is highlighted across all profiles with a hatched box.

