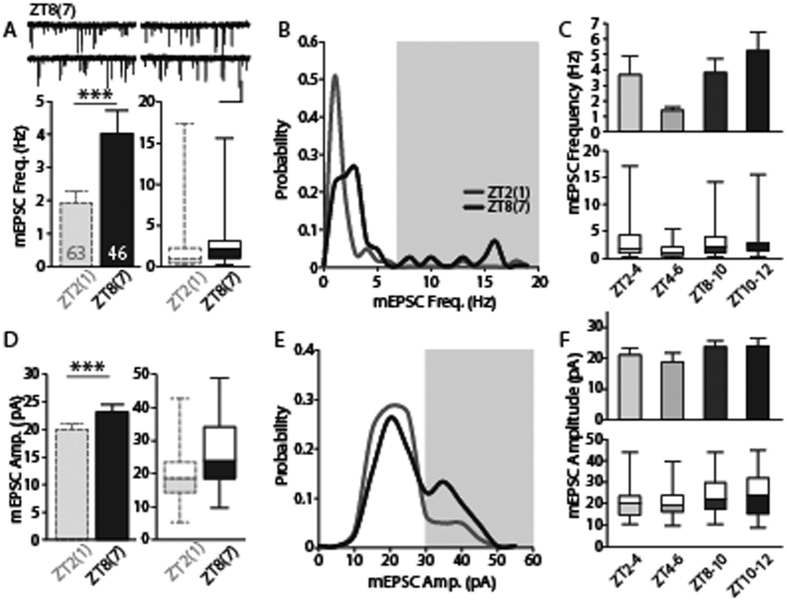
Figure 2. There are significant differences in the frequency and amplitude of mEPSCs of the lateral habenula (LHb) depending on the time of the day.
(A) mEPSC frequency was 3.76 ± 0.65 Hz (46 cells from 11 animals) during ZT8–12 (sacrificed at ZT7; ZT8(ZT7) group), which was higher than that of the ZT2(ZT1) group (p < 0.01 by t-test, p < 0.01 by bootstrap) and comparable to that of the ZT8(ZT1) group shown in Fig. 1 (p > 0.2 by t-test, p > 0.2 by bootstrap). Representative traces are shown at the top of each panel (scale bars: 1 s and 40 pA). (B) mEPSC frequencies in each group were not normally distributed (ZT2(ZT1): p < 0.001; ZT8(ZT7): p < 0.001, Shapiro-Wilk test). In addition, the mEPSC frequency distribution at ZT8(ZT7) group was shifted to the right compared to that of ZT2(ZT1) group. There were significantly more neurons with high-frequency mEPSCs (>7 Hz) in the ZT8(ZT7) group (p < 0.05, χ2 test). (C) Analysis of mEPSC frequencies in 2-hr time window revealed a temporal oscillation during the light phase (F (3, 86) = 3.29, p < 0.05, one-way ANOVA), however there was no difference within ZT2(ZT1) group or ZT8(ZT7) group (p > 0.2 between ZT2-4 and ZT4-6; p > 0.9 between ZT8-10 and ZT10-12, Tukey’s post hoc test). (D) The average mEPSC amplitude in the ZT8(ZT7) group was 23.41 ± 1.34 pA, which was larger than the average amplitude in the ZT2(ZT1) group (p < 0.05 by t-test, p < 0.05 by bootstrap). (E) The mEPSC amplitudes in the two groups were not normally distributed (ZT2(ZT1): p < 0.001; ZT8(ZT7): p = 0.098, Shapiro-Wilk test) and the distribution was shifted towards larger amplitudes (>30 pA) in the ZT8(ZT7) group compared to the ZT2(ZT1) group (p < 0.05, χ2 test). Representative traces are shown at the top of the figure. (F) 2-hr time block analysis of mEPSC amplitudes showed no variations during light phase (F (3, 86) = 4.06, p > 0.4 one-way ANOVA).

