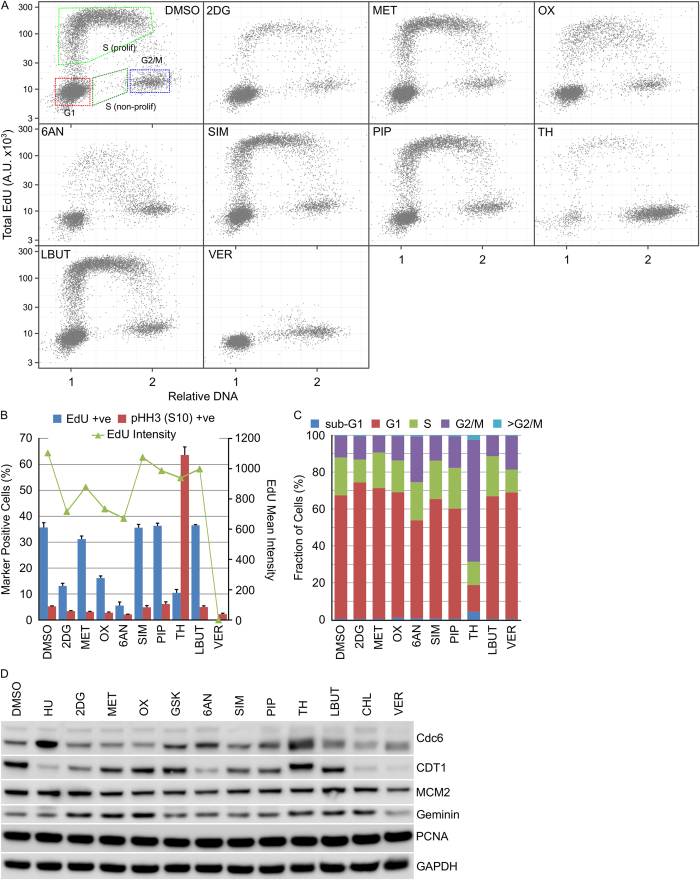
Figure 5. Cell cycle distribution in HT29 cells is differentially affected by metabolism modulators.
HT29 cells were treated with the indicated metabolism modulators for 24 hours then EdU for a further 15 minutes. DNA content, EdU incorporation and pHH3 (S10) expression was determined using single cell immunofluorescence analysis. (A) Single cell plots of relative DNA content versus total nuclear EdU demonstrating the different cell cycle populations. (B) Quantification of cell populations positive for EdU incorporation or pHH3 (S10) expression (n = 3, mean ± SD). (C) Determination of cell cycle distribution based on total nuclear DNA content (n = 3, mean). (D) Cell lysates prepared from HT29 cells treated with the indicated metabolism modulators were immunoblotted using the indicated antibodies (n = 1).

