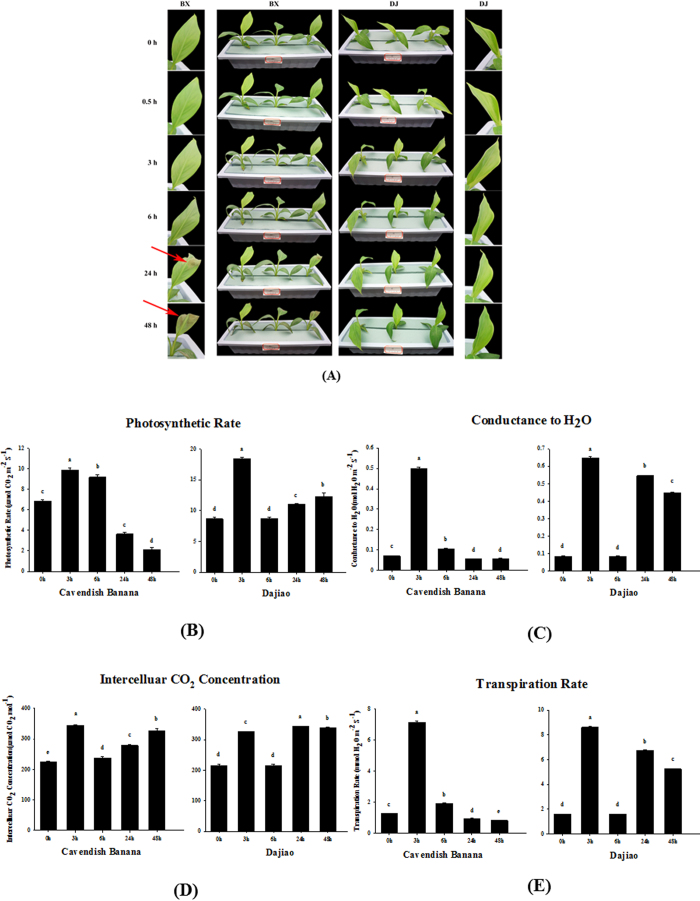
Figure 1. Physiological responses of Cavendish Banana and Dajiao under cold stress.
Five leaf stage seedlings were treated at 10 °C for 0, 0.5, 3, 6, 24 and 48 h (A). The photosynthetic rate (Photo), conductance to H2O (Cond), the intercellular CO2 concentration (Ci) and transpiration rates (Trmmd) are shown in (B–E), respectively. Each column means ± S.D. of three biological replicates with each having three to five technical replicate measurements. The different lowercase letters labeled above columns indicate a significant difference at p ≤ 0.05 between the columns by Duncan’s test using SPSS statistical software (version 16.0, SPSS Inc. Chicago, IL). The columns with the same letters mean no significant difference (p > 0.05) between each other.

