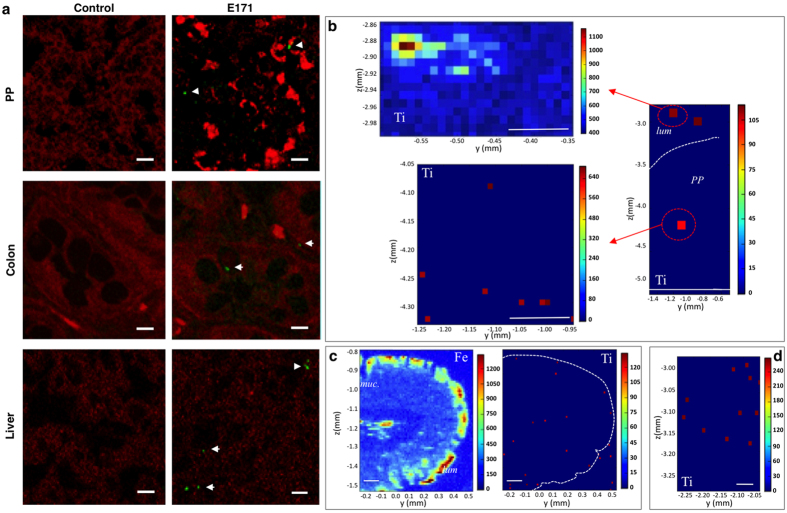
Figure 1. Tissue distribution of E171 particles in the rat intestine and liver after 7 days of oral exposure.
(a) Confocal images of PP, colon and liver tissue sections from control and E171-treated rats showing tissue autofluorescence in red and light-scattering TiO2 particles in green (arrowheads) (scale bars 10 μm). (b–d) μXRF mapping of Ti distribution (red pixels) in PP (b), colon (c), and liver (d) tissue sections. In (b), the two left panels show Ti distribution in PP vs. the luminal side (lum) in higher resolution maps (10X) (scale bars 100 μm). In (c), note the presence of Ti overlaying iron (Fe)-rich epithelial cells lining the colonic mucosa (dashed line in the right panel) and Ti distribution in the mucosa (muc) (scale bars 100 μm). In (d), a tissue section from the liver in a Ti-rich area close to the portal vein sinus is shown (scale bar 50 μm).

