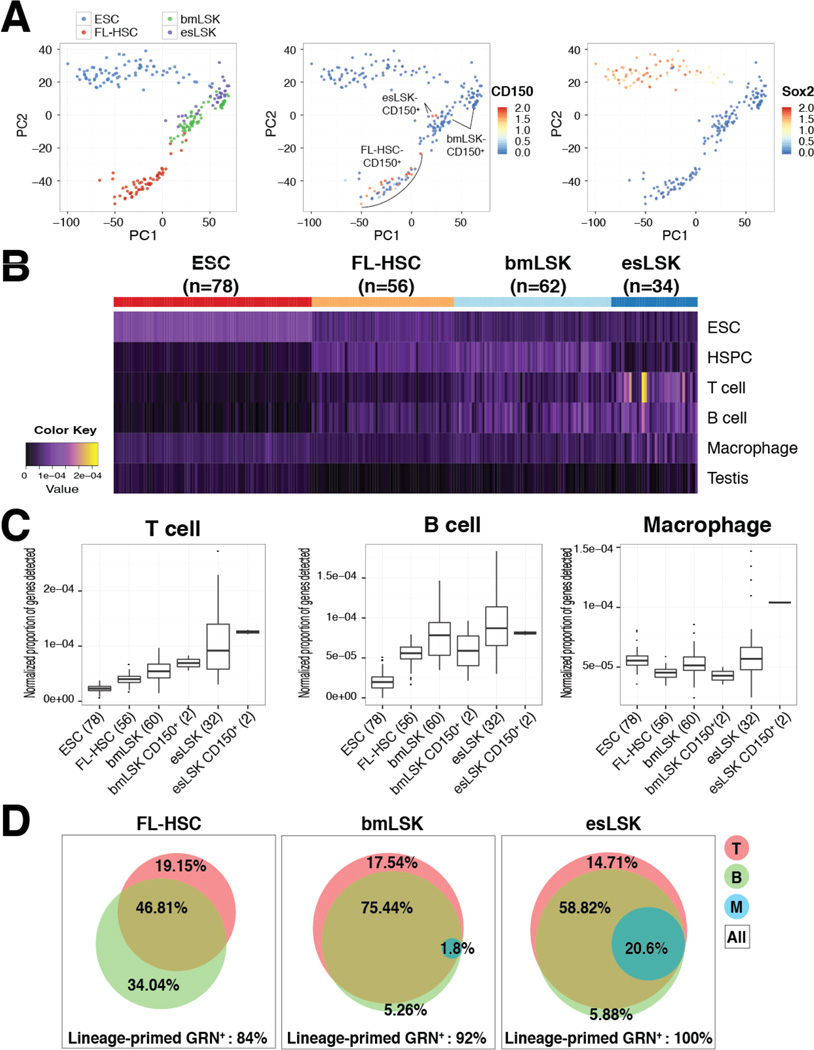
Figure 7. Multi-lineage-priming Within esLSK at Single-cell Level.
(A) PCA of ESC, FL-HSC, bmLSK and esLSK (left) and RaceID identification of CD150+ (middle) and Sox2+ (right) single cells. (B) Heatmap of genes most critical to the CellNet classifier for ESC, HSPC, T cell, B cell, macrophage and Testis. Each column represents a single-cell transcriptome of indicated sample groups. (C) Proportion of lineage-specific genes detected within indicated single-cell transcriptomes. (D) Area-proportional Venn diagram of percent GRN+ (T, B and M) single-cells over total cells analyzed (All). See also Fig.S7.

