Fig. 1.

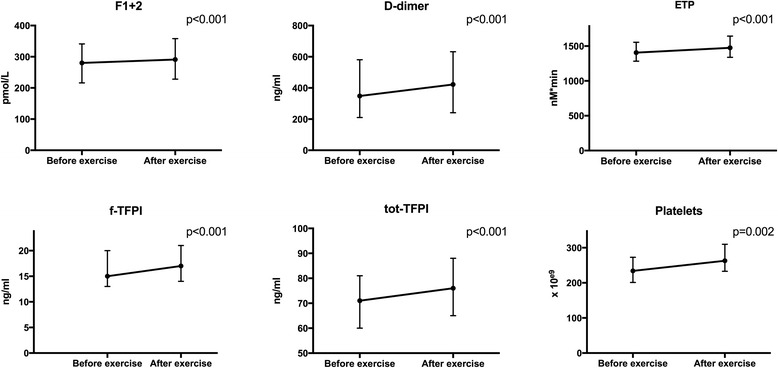
Levels of haemostatic markers before and after exercise in the total population (unadjusted for hematocrit). P-value refers to change from before to after exercise. The error bars on graphs represents 25th and 75th percentiles

Levels of haemostatic markers before and after exercise in the total population (unadjusted for hematocrit). P-value refers to change from before to after exercise. The error bars on graphs represents 25th and 75th percentiles