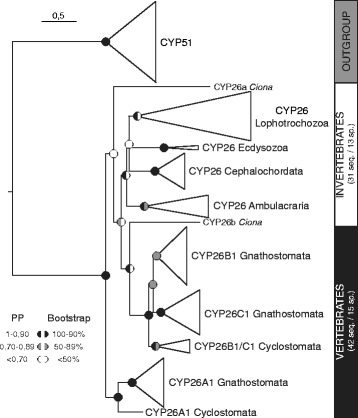
Fig. 1.

Phylogenetic analysis of the CYP26 subfamily. Diagrammatic summary of Bayesian Inference (BI) and Maximum Likelihood (ML) analyses of the phylogenetic relationships within the CYP26 subfamily, with CYP51 used as outgroup. The detailed tree is shown in Additional file 2 and sequence information is given in Additional file 1. Branch lengths are representative of the amino acid substitution rate and branch support is indicated at each major node as posterior probabilities (PP) for the BI tree and as bootstrap percentages for the ML tree. Furthermore, the total number of sequences (seq.) and species (sp.) is provided for the CYP26 subfamily
