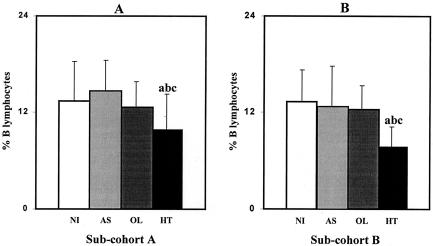
FIG. 1.
Mean percentage of B cells in the peripheral blood of different populations of HTLV-1-infected individuals (AS, OL, and HT individuals) and NI controls. (A) Analysis of subcohort A; (B) analysis of subcohort B. Significant differences (P < 0.05) are identified by the letters a, b, and c in comparison to results for NI, AS, and OL groups, respectively.

