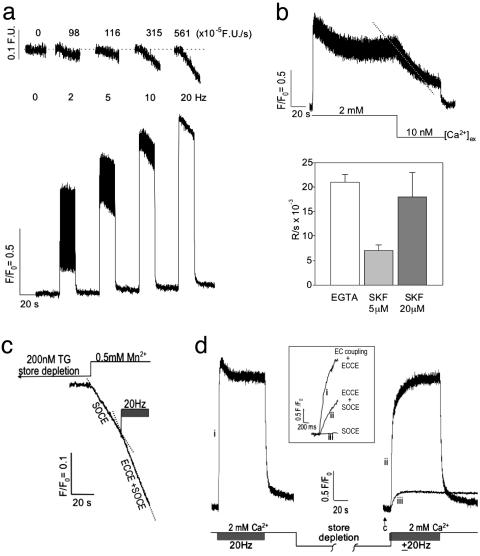
Fig. 2.
Electrical-field stimulation induces ECCE. (a)Ca2+ transients produced in primary myotubes (n = 15) in response to trains of electrical stimuli at 2, 5, 10, and 20 Hz (25-msec duration, 3 V) in the presence of 2 mM [Ca2+]o.(Upper) The rate of Mn2+ entry is proportional to the stimulus frequency monitored by the quench in fura-2 fluorescence. (Lower) Ca2+ transients exhibit an initial peak that decrements to a S-S level that is sustained for the duration of the pulse train. (b) (Upper) Removal of external Ca2+ results in the loss of the S-S response (dashed trace). (Lower) Likewise, SKF-96365 produces a decay of the S-S phase of the response with a rate that depends on the concentration of this SOCC blocker. The decay of the S-S phase subsequent to buffering [Ca2+]o with EGTA or brief addition of SKF-96365 is summarized (mean and SE from n = 8, 3, and 3 myotubes, respectively). The decay rate of the S-S phase observed in the presence of 20 μM SKF-96365 (SKF) was not significantly different from that measured when [Ca2+]o was removed from primary myotubes (P > 0.05). Field stimuli are at 3 V and 25 ms in duration at 20 Hz, and Ca2+ transients were recorded with fluo-4. (c) Quench of fura-2 fluorescence in response to Mn2+ entry from the external medium subsequent to complete store depletion with 200 nM TG was ascribable to SOCE. A pulse train initiated after measurement of the SOCE component resulted in an ≈2-fold increase in the rate of quench (ECCE plus SOCE). The trace shown is an average from three myotubes. See the text for rates. (d) The responses of WT myotubes to a pulse train before and after store depletion (without the use of SERCA blocker TG) using fluo-4 gave a rapid rate of Ca2+ rise (time to peak, <100 msec). After an initial pulse train in the presence of 2 mM [Ca2+]o, aCa2+-free solution was applied and the cells were challenged four to six times (30 sec each) with 20 mM caffeine. The last caffeine challenge failed to produce measurable Ca2+ release from the SR (arrow). Rapid substitution of 2 mM [Ca2+]o in the presence (trace ii) or absence (trace iii) of a train of electrical pulses resulted in a significantly different initial rates of rise for cytoplasmic Ca2+. (Inset) An expanded time scale of the initial rates of Ca2+ entry for EC coupling plus ECCE (trace i), ECCE plus SOCE (trace ii), and SOCE (trace iii). Rates are given in the text. Data were acquired at 20 Hz by using photometry. Data shown is an average of three myotubes and is representative of data acquired from at least 10 cells in separate culture wells and on separate days.

