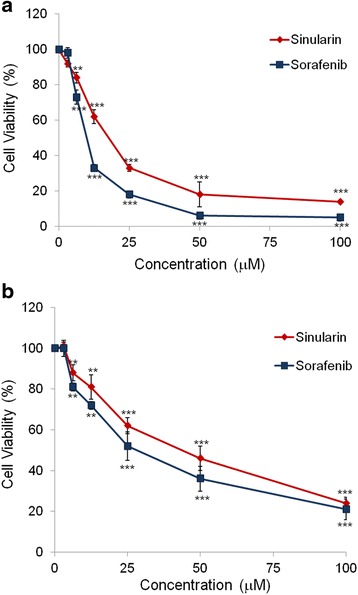
Fig. 1.

Analysis of cell viabilities in HCC cell lines. Percentages of cell viabilities of (a) HepG2 and (b) Hep3B cells after treating with sinularin or sorafenib at different concentrations for 24 h. Cell viabilities were plotted and represented as means ± SD. All data presented are representatives of three independent experiments with similar results. Significant differences from DMSO treated control group are indicated by **p < 0.01, ***p < 0.001
