Fig. 4.

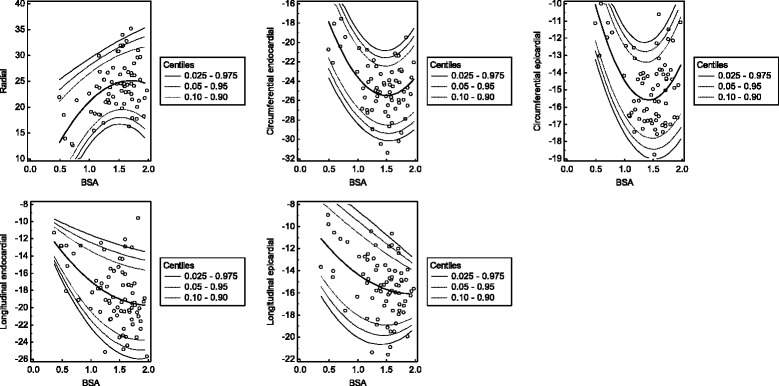
Scatter plots of the global peak systolic strains with regard to BSA. The calculated mean (central line) as well as the 0.025, 0.05, 0.10, 0.90, 0.95 and 0.975 centiles are displayed. Strain values are given as % and BSA is given as m2

Scatter plots of the global peak systolic strains with regard to BSA. The calculated mean (central line) as well as the 0.025, 0.05, 0.10, 0.90, 0.95 and 0.975 centiles are displayed. Strain values are given as % and BSA is given as m2