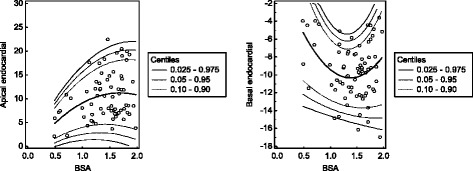
Fig. 7.

Maximum cardiac rotation. The calculated mean (central line) as well as the 0.025, 0.05, 0.10, 0.90, 0.95 and 0.975 centiles are displayed. In most of the subjects, the apical rotation was counterclockwise (positive values) and the basal rotation is clockwise (negative values). Of note, in 18.9% of the cases the maximum apical rotation values were negative and in 18.9% of the cases the maximum basal rotation values were positive. Rotation is given as degrees and BSA is given as m2
