
Fig. 3.
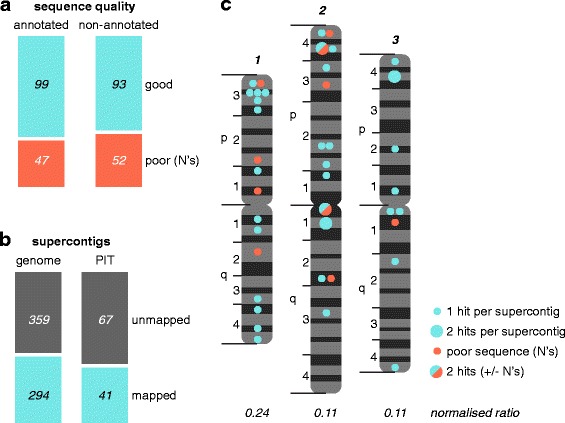
Interrogation of the Ae. aegypti genome annotation using PIT. a Sequencing gaps surrounding 145 previously non-annotated proteins identified by PIT (‘new annotation’ in Fig. 2C) compared to a matched sample of annotated Ae. aegypti genes (Additional file 7). b Number of supercontigs within the Ae. aegypti genome assembly, or the subset containing new annotation from PIT, that have been mapped to chromosomal locations [48]. c Supercontigs to which our PIT hits align mapped to the three Ae. aegypti chromosomes (map modelled on [48]). The normalised ratio of PIT-containing supercontigs to total mapped supercontigs per chromosome is also specified. Full mapping data given in Additional file 3