Fig. 1.
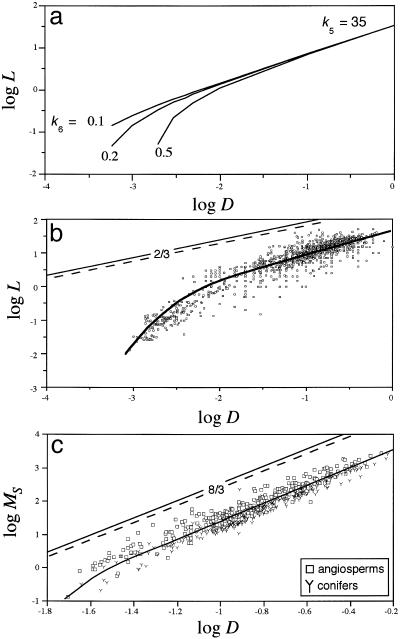
Predicted and observed scaling relationships for plant height L (m), basal stem diameter D (m), and total stem dry mass MS (kg). (a) Hypothetical relationships between L and D predicted by Eq. 5 for three different values of k6 when k5 = 35. With increasing numerical values of D, the slope of the log-log L vs. D relationship converges on 2/3; with decreasing values of D, the relationship becomes more log-log nonlinear and convex, as predicted by Eq. 5. (b) The scaling of L with respect to D across self-supporting herbaceous plants and trees. Predictions of the mechanical theory (using the Euler-Greenhill formula for stems with tapering modes α = 0 and α = 1, respectively) are indicated by dashed and solid straight lines, respectively. Prediction of the growth-hydraulic model shown by the solid curved line (using Eq. 5, k5 = 34.64, and k6 = 0.475). The model predicts a log-log linear relationship with a slope of 2/3 for large values of D. The scatter observed for data points is attributed to species- and site-specific differences in k5 and k6 (as a consequence of different growth rates and allocation patterns to stem, leaf, and root construction). (c) The scaling of MS with respect to D. Data from the Cannell compendium and other primary sources. Predictions of the mechanical theory are shown by dashed and solid straight lines (for stems with tapering modes α = 0 and α = 1, respectively). Prediction of the growth-hydraulic model is shown by the solid curved line (using Eq. 6), which has a slope of 8/3 for large values of D.

