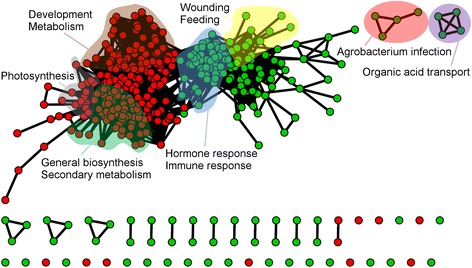
Fig. 4.

Both trimers and long OGs trigger the up-regulation of immune and stress responses and the down-regulation of metabolism. The GSEA map was made using the cytoscape plugin Enrichment map (Bader lab), depicting the results of combined data for trimers and long OGs (combined gene expression data for trimers and long OGs at 3 h as reported by Denoux et al. 2008) using a P-value cut-off of <0.05. Colored areas indicate gene set clusters of with common functionality. Green indicates up-regulated gene sets, and red indicates down-regulated gene sets
