
Fig. 1.
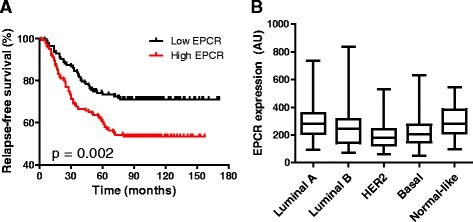
Kaplan–Meier analysis in breast cancer patients based on EPCR expression levels. a Relapse-free survival analysis of all patients included in the GSE2034 cohort (n = 286), classified into “high EPCR” and “low EPCR” based on median expression value of EPCR. b EPCR expression levels in the primary tumors, classified by molecular subtype. Whiskers represent minimum and maximum values. AU, arbitrary units