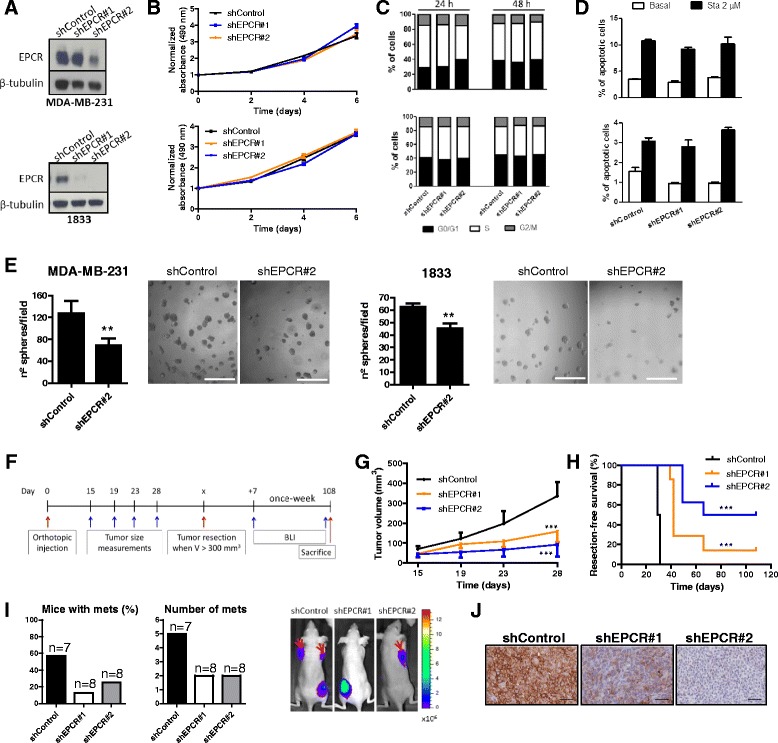
Fig. 2.

Effects of EPCR silencing in vitro and in vivo tumor growth in an orthotopic xenograft model. a Western blot analysis of EPCR protein levels in MDA-MB-231 and 1833 cells transduced with a scramble shRNA (shControl) and two different shRNAs targeting human EPCR (shEPCR#1 and shEPCR#2). β-tubulin was used as loading control. b MTS in vitro proliferation assay of MDA-MB-231 (top) and 1833 (bottom) cells. Data were normalized with absorbance values from day 0 and represent mean ± SD of six replicates. Experiments were repeated three times with similar results. c Percentage of MDA-MB-231 (top) and 1833 (bottom) cells in each phase of the cell cycle, after maintaining cells in culture for 24 and 48 h. d Percentage of apoptotic MDA-MB-231 (top) and 1833 (bottom) cells in basal and staurosporine-induced conditions, measured by annexin-V binding flow cytometry assay. Data are mean ± SD of triplicates and representative of three independent experiments. Sta staurosporine e Quantification of spheres grown in 3D matrigel cultures. Data are mean ± SD of 8 replicates from two independent experiments. Representative images at ×4 magnification. Scale bar 0.5 mm. f Outline of the in vivo orthotopic experiment (n = 8 per group). g Quantification of tumor volume until day 28 post-injection. Each dot represents mean ± SEM. h Kaplan–Meier curves of resection-free survival. I Incidence of metastatic events and representative images showing metastases (red arrows), assessed by BLI. Mets metastases. j Representative images at ×20 magnification showing immunohistochemical staining of EPCR in formaldehyde-fixed mammary tumors. Scale bar 50 μm. **p < 0.01, ***p < 0.001
