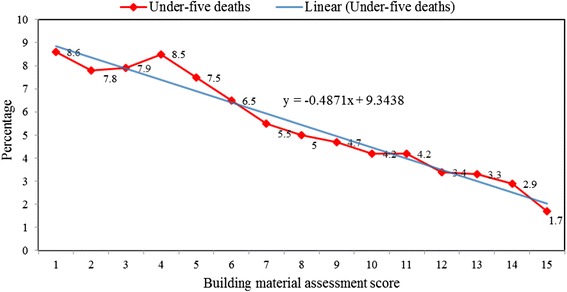
Fig. 1.

Percentage distribution of under-deaths by housing material assessment score. It presents a downward trend (slope = −0.4871) in the percentage distribution of childhood deaths according to the building materials assessment score with highest and least proportion of under-five children found among those who live in a house with 1 and 13 building assessment scores respectively
