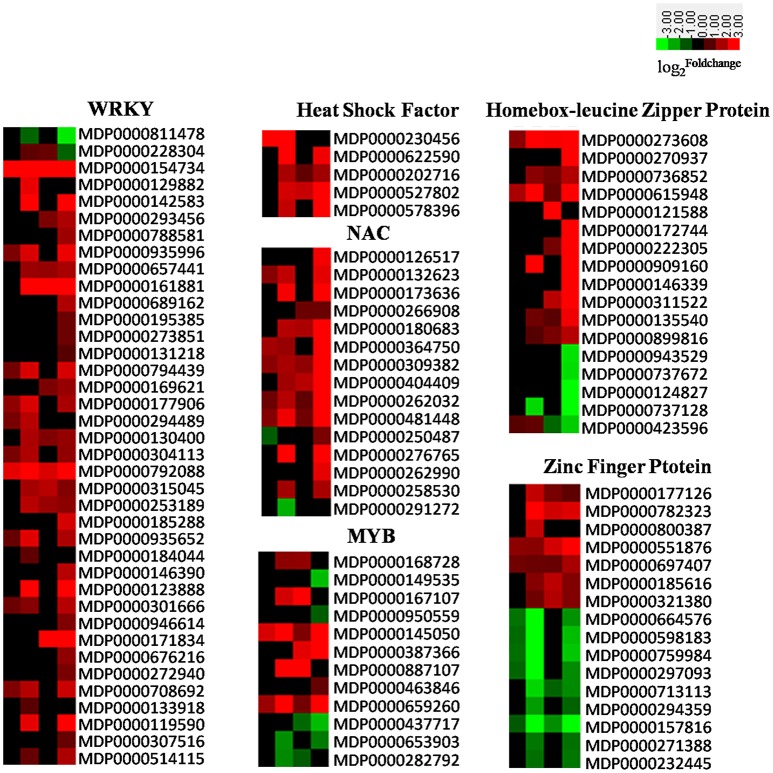
Figure 7.
Heatmaps of DEGs encoding transcriptional factors including WRKYs, HSFs, NACs, MYBs, zinc finger proteins, and homebox-leucine zipper proteins. The was colored using Cluster 3.0 (i.e., red for up-regulated, green for down-regulated), each horizontal row represents a DEG with its gene ID, and the vertical columns represent 12, 18, 36, and 72 HPI from left to right.

