Figure 3.
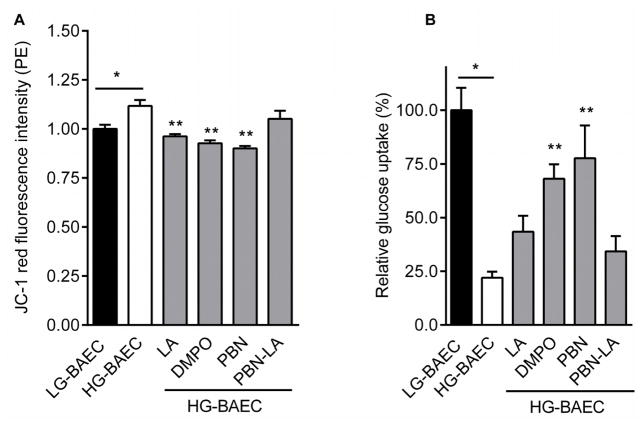
Effect of nitrones on glucose transport and mitochondrial depolarization. (A) Plot of relative JC-1 dye intensity after HG-BAEC were treated with nitrones for 24 h (50 μM, n = 3). (B) Plot of relative glucose uptake of LG-BAEC, HG-BAEC and HG-BAEC treated with nitrones 24 h (50 μM, n = 3). All data represented as the mean ± SEM, *p < 0.05 vs. untreated LG-BAEC, **p < 0.05 vs. untreated HG-BAEC.

