Figure 4.
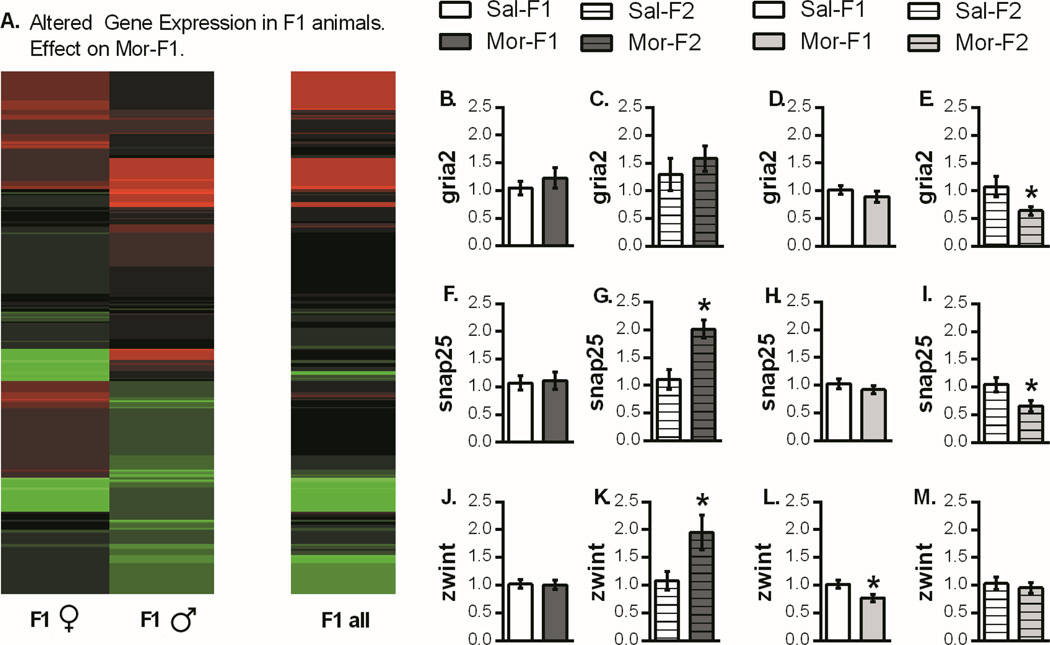
Analysis of Pac-Bio sequencing data and synaptic plasticity genes. (A) Differential expression analysis produced a list of genes whose expression was > 10 counts per million. These genes were used to generate a heat map showing the gene expression changes in Mor-F1 animals relative to Sal-F1 animals. qPCR analysis of synaptic plasticity genes are presented as fold change relative to control (mean +/− SEM). There was no change in Gria2 expression in Mor-F1 males or females (4B, 4D) or in Mor-F2 males (4C). However, there was a decrease in expression in Mor-F2 females compared with Sal-F2 females (4E). For Snap25, there was no change in either sex in the F1 generation (4F, 4H). However, in the F2 animals there was increased expression in Mor-F2 males (4G) and decreased expression in Mor-F2 females (4I). Finally, for Zwint, there were no differences in F1 males (4J) but there was an increase in Mor-F2 males (4K). There was also a decrease in Mor-F1 females (4L) but no change in Mor-F2 females (4M). *p<0.05 detected with a two tailed student’s t-test. n=8 for all groups except Mor-F1 males (n=7) and Mor-F1 females (n=7)

