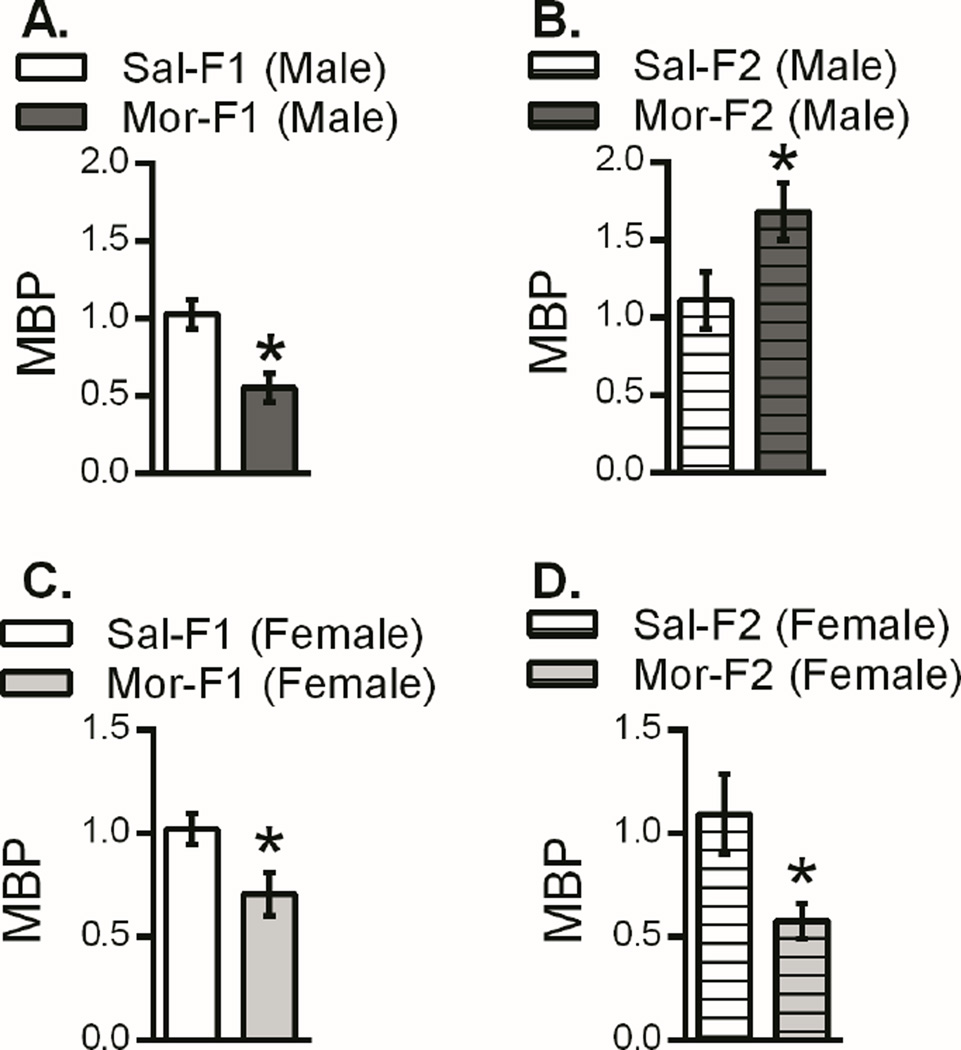
Figure 5.
Expression of myelin basic protein in the nucleus accumbens of male and female F1 and F2 animals. Data are presented as fold change relative to control (mean +/− SEM). In both Mor-F1 males and females there was a down regulation of Mbp relative to the respective Sal-F1 control (5A, 5C). In the F2 generation, the Mor-F2 females continued to show this down regulation of Mbp (5D) while Mor-F2 males showed an increase in expression levels (5B). *p<0.05 detected with a two-tailed student’s t-test. n=8 for all groups except Mor-F1 males (n=7) and Mor-F1 females (n=7)

