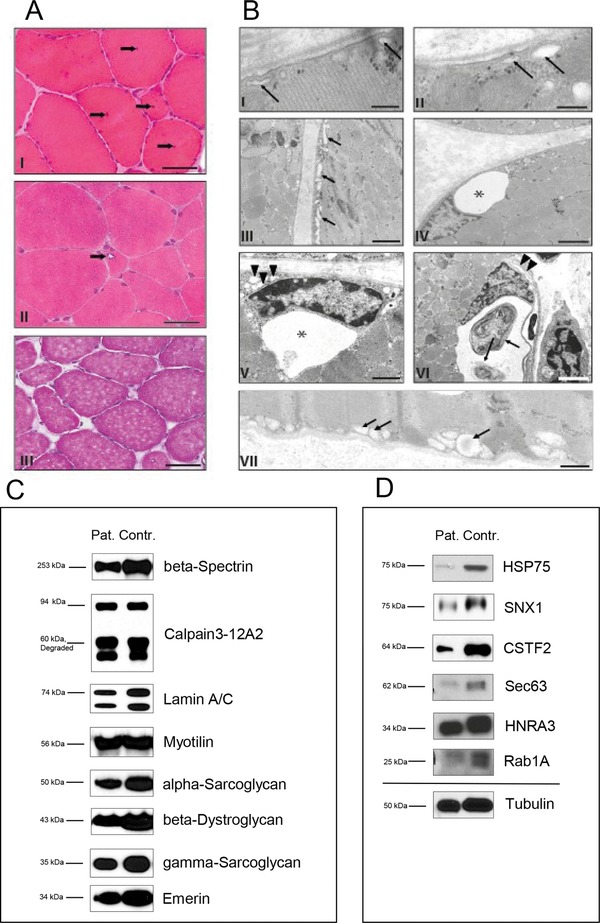
Figure 1.

Analysis of patient material. Microscopical investigations (1A): (I) M. vastus lateralis biopsy of patient 1 showing a myopathic pattern with minor muscle fiber atrophy and hypertrophy as well as frequent nonsubsarcolemmal nuclei (arrows). Cryostat section, H&E. Scale bar: 80 μm. (II) Low‐grade muscle fiber atrophy and solitary rimmed vacuole (arrow) in cryostat section of the rectus femoris muscle biopsy of patient 2. Cryostat section, H&E. Scale bar: 50 μm. (III) M. quadriceps femoris biopsy of patient 3 showing minor atrophic as well as hypertrophic muscle fibers. Cryostat section, H&E. Scale bar: 80 μm Electron microscopic studies (1B): (I) Subsarcolemmal membrane‐bound vacuoles, presumably corresponding to enlarged caveolae (arrows) in the muscle biopsy of patient 1. Scale bar: 250 nm. (II–VI) Patient 2; (II) subsarcolemmal membrane‐bound vacuoles (arrows) similar to the one depicted in Fig. 1A. Scale bar: 200 nm. (III) Further abnormal membrane bound subsarcolemmal vacuoles as well as tubular structures (arrows). Scale bar: 2 μm. (IV) Large vacuole (asterisk) associated with a myonucleus. Scale bar: 4 μm. (V) Large (asterisk) and small (arrowheads) vacuoles in the vicinity of a myonucleus. Scale bar: 2 μm. (VI) Large vacuole containing autophagic material (arrows) associated with a deformed, possibly degenerating myonucleus. Arrowheads: Membranous material, presumably corresponding to a focal outfolding of the sarcoplasmic reticulum. Scale bar: 4 μm. (VII) Patient 3: subsarcolemmal membrane‐bound vacuoles (arrows). Scale bar: 800 nm. Immunoblots of myopathy‐associated proteins (1C): comparison of beta‐Spectrin, Calpain‐3, Lamin A/C, Myotilin, alpha‐ and gamma‐Sarcoglycan, beta‐Dystroglycan and Emerin in G56S Caveolin‐3 patient and control muscle revealed no significant changes in protein abundances. Confirmation of proteome data via immunoblotting (1D): immunoblot analyses of HSP75, SNX1, CSTF2, Sec63, HNRA3, and Rab1A revealed same changes in protein abundances upon G56S Caveolin‐3 expression like in the G56S Caveolin‐3 in vitro model. Tubulin was used as loading control.
