
Figure 1.
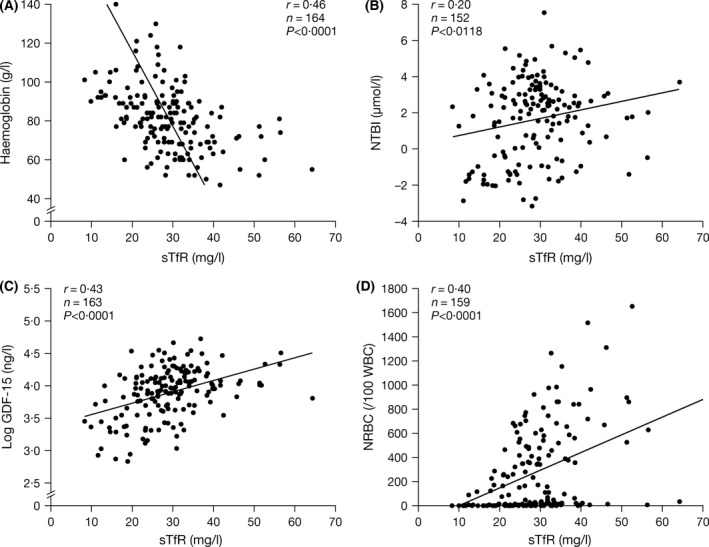
Correlations between sTfR and (A) Hb (B) NTBI (C) GDF‐15 and (D) NRBCs. Evaluable biomarkers of erythroid expansion generally correlated with each other. The strong negative correlation of Hb levels with sTfR supports the concept that sTfR levels reflect erythroid mass, which increases with greater anaemia. GDF‐15, growth differentiation factor‐15; Hb, haemoglobin; NRBC, nucleated red blood cells; NTBI, non‐transferin‐bound iron; sTfR, soluble transferrin receptor.