
Figure 4.
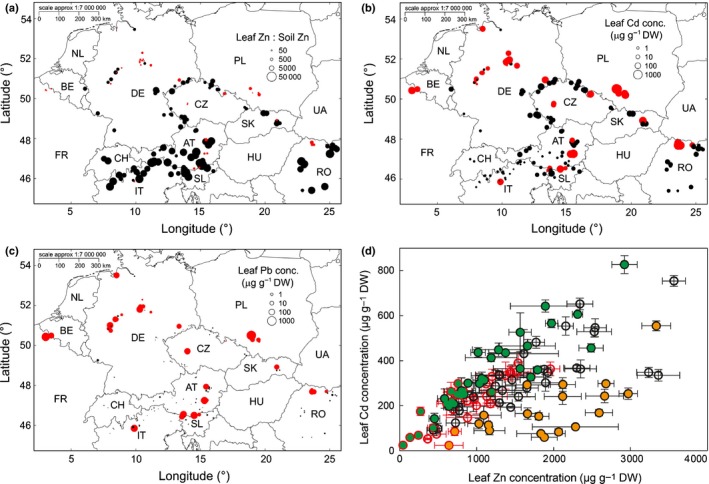
Biogeographical signatures of metal accumulation. (a–c) Maps showing population median of leaf zinc (Zn) accumulation efficiency (ratio of leaf Zn to soil exchangeable Zn concentration, a), leaf cadmium (Cd) concentration (b), and leaf lead (Pb) concentration (c) in Arabidopsis halleri sampled at natural sites of growth in the field. Note that ratios become inaccurate where the concentration of an element in soil approaches zero. (d) Relationship between leaf Cd and Zn concentrations of A. halleri cultivated under standardized controlled growth chamber conditions. Red symbols/borders, metalliferous sites/soil origin; black symbols/borders, nonmetalliferous site/soil origin (a–d). Each datapoint (d) represents one individual (mean ± SD, n = 5 vegetative clones per individual; see also Fig. 3). Orange circles, Zn‐to‐Cd ratio > 6.91 (75th percentile) and population originating from the South (IT, Italy; CH, Switzerland; SL, Slovenia; AU, Austria compare a). Green circles, Zn‐to‐Cd ratio < 3.53 (25th percentile) and population originating from the East or North (DE, Germany; CZ, Czech Republic; SK, Slovakia; PL, Poland; RO, Romania; FR, France; BE, Belgium, compare b). Percentiles refer to all individuals from nonmetalliferous soil origin, and a uniform colour was applied to all individuals of a population when at least one individual met the quantitative criteria (see Supporting Information Notes S5).