
Figure 5.
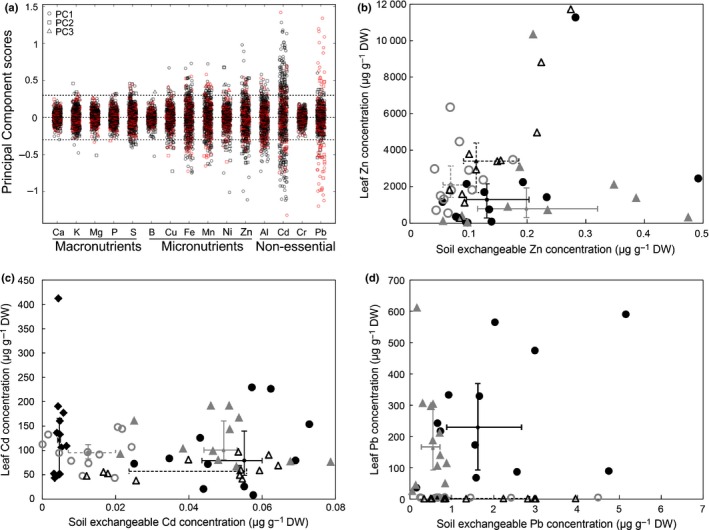
Variation in leaf element concentrations within natural populations of Arabidopsis halleri sampled in the field. (a) Overview of within‐population variation in leaf element concentrations. Al, aluminium; B, boron; Ca, calcium; Cd, cadmium; Cr, chromium; Cu, copper; Fe, iron; K, potassium; Mg, magnesium; Mn, manganese; Ni, nickel; P, phosphorus; Pb, lead; S, sulfur; and Zn, zinc. Each datapoint reflects the magnitude of residual within‐population variation in leaf element concentration that is unexplained by variation in soil composition, for each population sampled at a metalliferous (red) or nonmetalliferous (black) site. (b–d) Examples of leaf metal concentrations shown in relation to local soil exchangeable metal concentrations for the individuals of populations of contrasting variation in Zn (b), Cd (c) and Pb (d) accumulation. Populations Idrija/SL (Slovenia) (closed circles, n = 12) and Hartelsberg/AT (Austria) (closed triangles, n = 10), and populations Poppermig/AT (open circles, n = 12) and Sankt Leonhard/IT (Italy) (open triangles, n = 11); all nonmetalliferous (b). Populations Ukanc/SL (closed diamonds, n = 12), Bad Gottleuba/DE (Germany) (closed circles, n = 11) and Runding/DE (closed triangles, n = 12), Zakopane/PL (Poland) (open circles, n = 12) and Regenstauf/DE (open triangles, n = 12), all nonmetalliferous (c). Populations Rabenstein Castle/AT (closed circles, n = 12) and Gailitz/AT (closed circles, n = 12), Lgota/PL (open circles, n = 12) and Eckertal/DE (open triangles, n = 12), all metalliferous (d). Smaller‐size symbols and bars show population medians and 25/75 percentiles (solid, closed‐symbol series; dotted, open‐symbol series), respectively (b–d). For (a), we first developed a global redundancy analysis (RDA) model across all samples at all sites, employing the standardized log10(x + 1) leaf element concentrations as a function of soil composition, that is, the standardized log10(x + 1) soil exchangeable element concentrations and standardized soil pH (n = 1972; see Supporting Information Fig. S5; standardization through z‐scores). Subsequently, we used the residuals from the RDA model to conduct a principal component analysis (PCA) for each of the 165 collection sites, and the resulting principal component scores are shown (PC1, circles; PC2, squares; PC3, triangles). In (b), two outlier datapoints are not shown: Sank_11 (x = 6.66; y = 28 400) and Hart_7 (x = 6.19; y = 313).