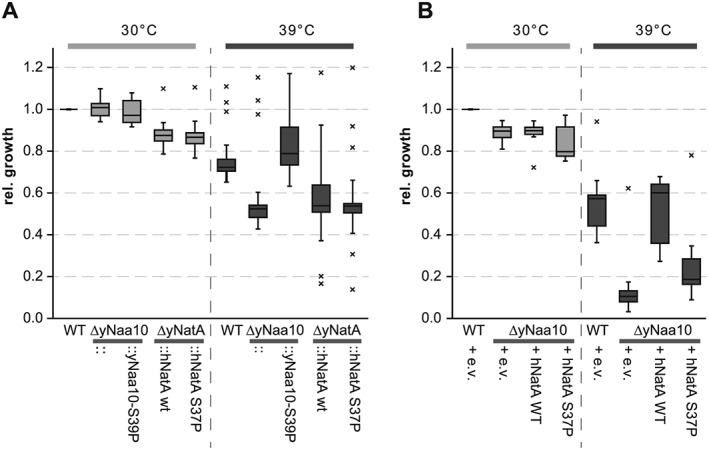
Figure 2.

Heat stress in liquid culture. Aliquots of 5 mL yeast cultures were grown at 30 or 39 °C and optical density was monitored. Shown is a box plot of the relative growth after 24 h for at least seven independent experiments for each strain under each condition. Values outside 1.5 times the interquartile range were considered outliers (and marked as such with an ×), and statistical analyses were performed using Student's t‐test. (A) Results for the endogenous strains; (B) the overexpressing strains. e.v. = empty vector
