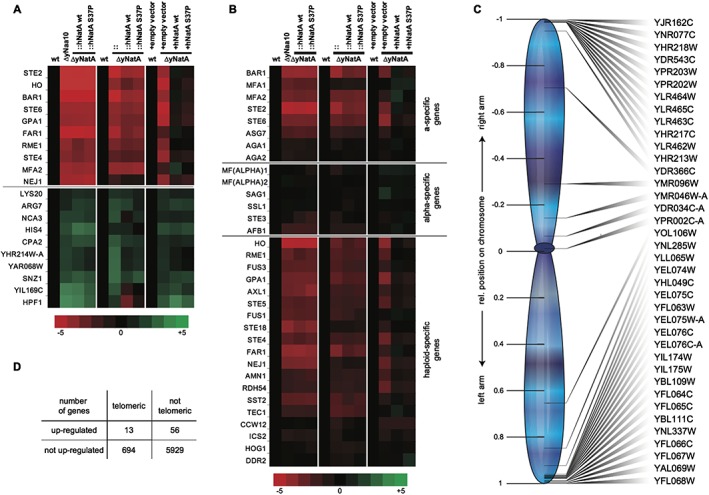
Figure 7.

Gene expression analysis. Heat map representation of the microarray results for the the Top 10 up‐ or downregulated genes in all knockout strains (A) and mating type specific genes (B). (C) Presentation of the relative position on the chromosome of the genes that were found to be upregulated by at least 3‐fold in the yNatA knockout (overexpressing strains only). (D) Telomeric enrichment analysis for the RNA‐seq data. A 2‐fold expression change and a Benjamini–Hochberg‐adjusted p‐values of <0.05 was used to identify upregulated genes in the knockout compared with WT (69 genes). The telomeric boundary was 40 kb (707 genes)
