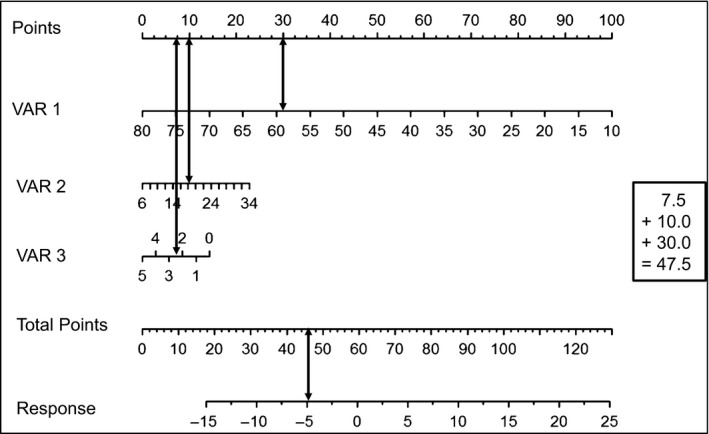
Figure 1.

Example of a nomogram. A nomogram can directly be used to calculate the predicted response. The nomogram visualizes the influence of the different predictive variables on different horizontal lines. Depending on the influence of each predictor, the different lines have different lengths. The longer a horizontal line the stronger is the influence. The influence of each predictor is visualized by a number of points on the respective horizontal line. By adding the points associated with each predictor, the anticipated magnitude of response can be read on the response horizontal line on the bottom of the nomogram. For the calculation of a response, three variables are required in the example: Response = x * VAR1 + x * VAR2 + x * VAR3. Calculation example of this nomogram: VAR1 = 58 (30 Points), VAR2 = 18 (10 Points), VAR3 = 2.5 (7.5 Points), Total Points = 47.5 (30 + 10 + 7.5), Response = −5.
