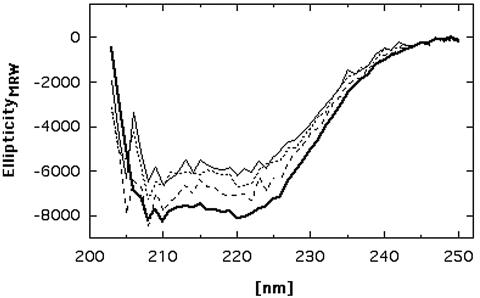
FIG. 3.
CD spectrum of CzcD. The spectrum was generated with 0.24 g of CzcD per liter (thick solid line). Additionally, the CD spectrum of CzcD at a concentration of 0.1 g/liter was obtained in the presence of 100 μM Zn2+ (dotted line), in the presence of 500 μM Zn2+ (dashed line), or without added zinc (thin solid line). Due to strong light scattering at wavelengths below 203 nm, data points could not be collected at these wavelengths. EllipticityMRW, mean residue molar ellipticity.

